A technique known as Differential Geomagnetic Sounding was initiated by Babour and Mosnier in 1977. Their idea was to isolate the "anomalous" magnetic field due to channeled current flow along lateral discontinuities in resistivity by simply differencing the outputs of time synchronized magnetometers at two widely separated points.
For a plane wave source, and well aligned magnetometers, the primary (external) field is cancelled as is the "normal" component of the secondary field due to currents induced within background earth structure. Anything remaining after the differencing can only be due to the "anomalous" magnetic field, arising from channeled current flow along anomalous local earth structure.
One issue with this approach is ensuring that both base and remote stations are in the same "normal" or background geological environment. As the the separation between base and remote stations increases, this becomes more difficult to satisfy and the desired primary and normal secondary field cancellation more approximate.
However, if both sets of magnetometers are kept closer, 10's of metres, as opposed to, 10's or 100's of km's, then not only will the primary and normal secondary fields be cancelled, but so will the anomalous secondary field to some degree. Whatever remains after differencing the outputs of two closely spaced sets of magnetometers is then proportional to the gradient of the internal (anomalous) magnetic field associated with channeled current flow along anomalous local earth structure, Internal Field Gradients.
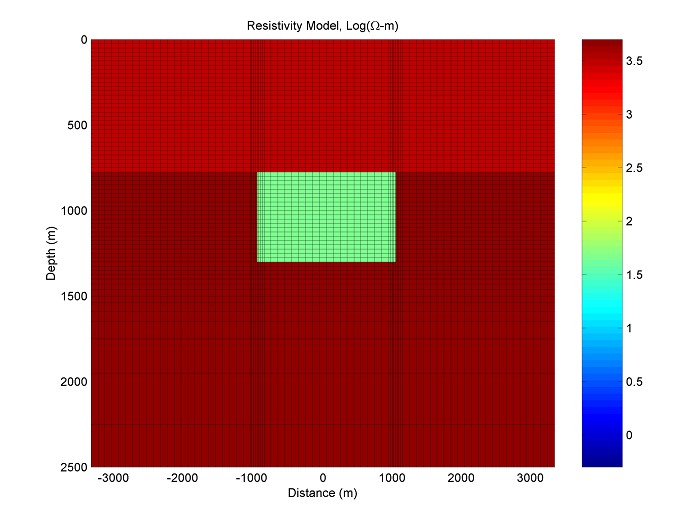
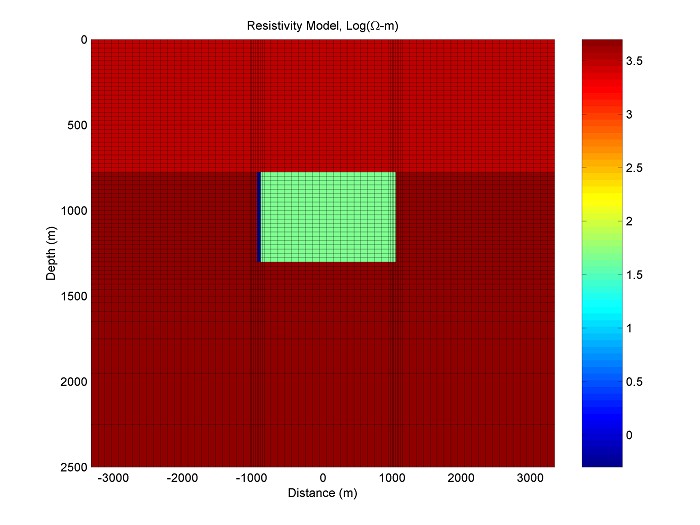
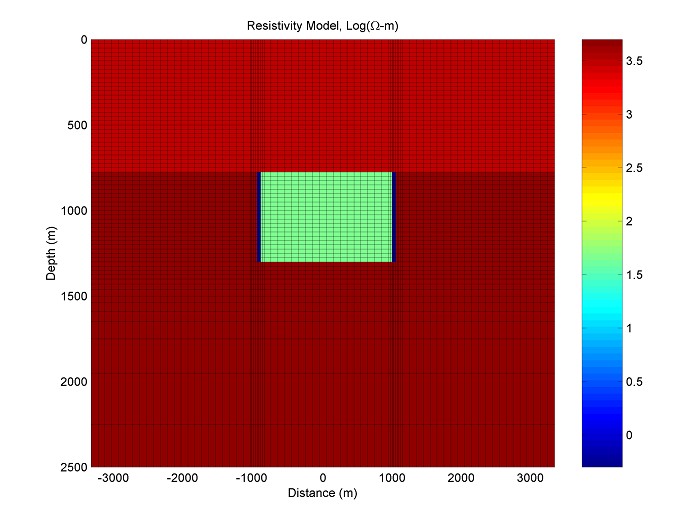
Consider the 2D models shown below. In the first case, a large but weakly conductive block with 50 Ohm-m resistivity, 2000 m wide, extending from from 800 m to 1300 m depth is centered on a resistive earth with the upper 800 m as 3000 Ohm-m resistivity while below 800 m depth (outside of the weakly conducting block) is 5000 Ohm-m resistivity.
Now add a 100 S conductor (50 m wide, 0.5 Ohm-m resistivity) at the left hand block edge.
Lastly, 100 S conductors (50 m wide, 0.5 Ohm-m resistivity) at both block edges is shown below.
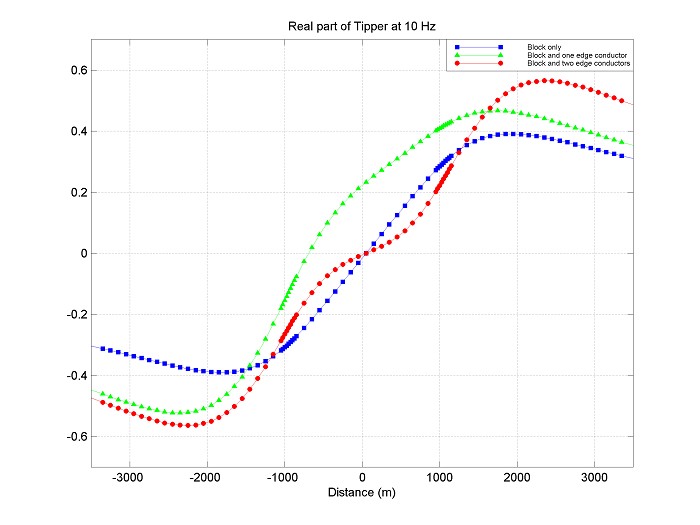
As seen below, the real part of the tipper at 10 Hz does show differences in the three cases but not dramatically so, especially in the "balanced" case of two 100 S edge conductors.
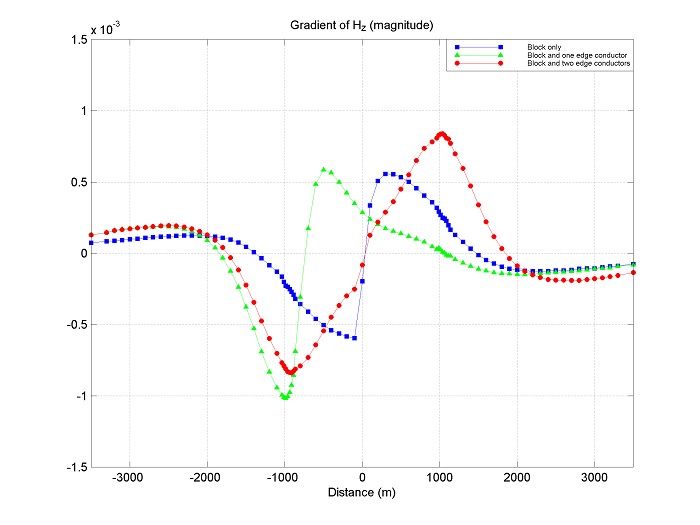
By comparison, the gradient of the magnitude of Hz (at 10 Hz) shows larger differences and the possibility of better discrimintating the three different situations.
Decreasing frequency to 1 Hz helps increases anomalous amplitudes associated with the 100 S conductors (see Otish case history, Surveys, for a discussion of conductor discrimination with tipper data as well) while the response associated with the large weakly conducting block decreases at 1 Hz as compared to 10 Hz.
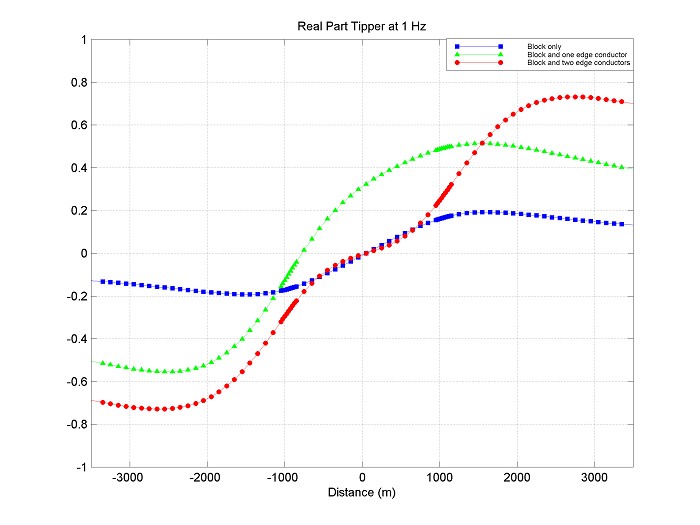
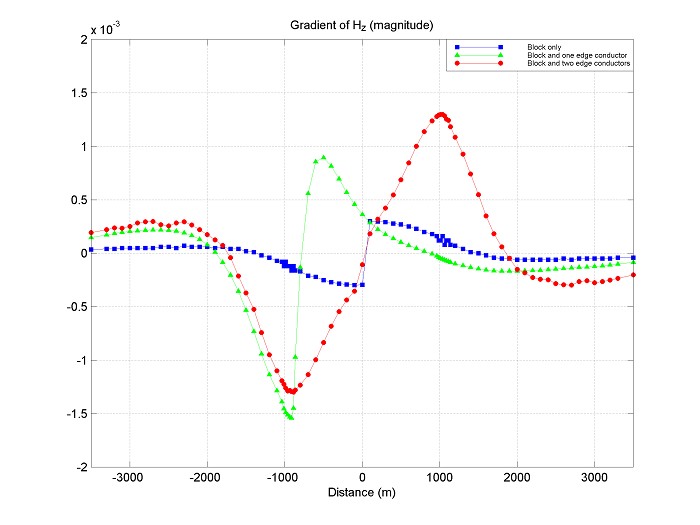
As discussed in the Otish case history, bandwidth is very important for conductor discrimination with tipper data, but given a certain fixed bandwidth, the gradients appear to be more discriminatory than the tipper data by itself.
The measurement of Internal Field Gradients may help to increase the resolution of conventional tipper data, especially when a strong conductor needs to be located within a larger, more weakly conducting zone, such as also occurs in porphyry copper, base metal and geothermal exploration.
However, it must be remarked that the 2D modeling shown above seems to be unrealistic as real gradient data collected shows much larger gradients in general and indicate that the gradients on the horizontal magnetic field components are the most diagnositc.
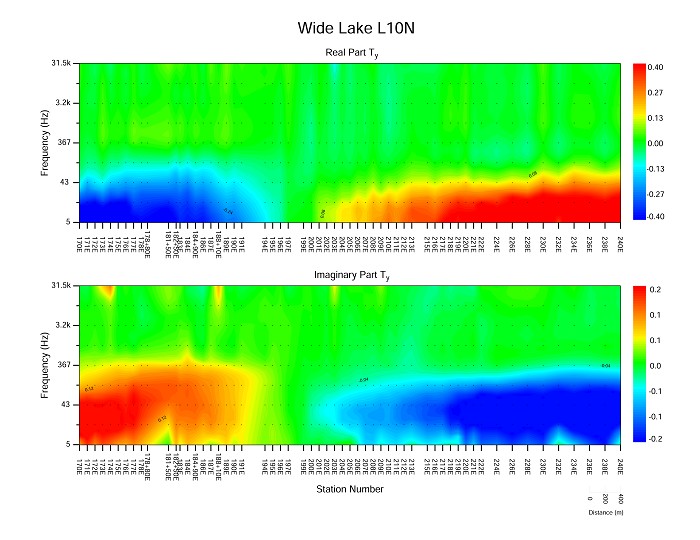
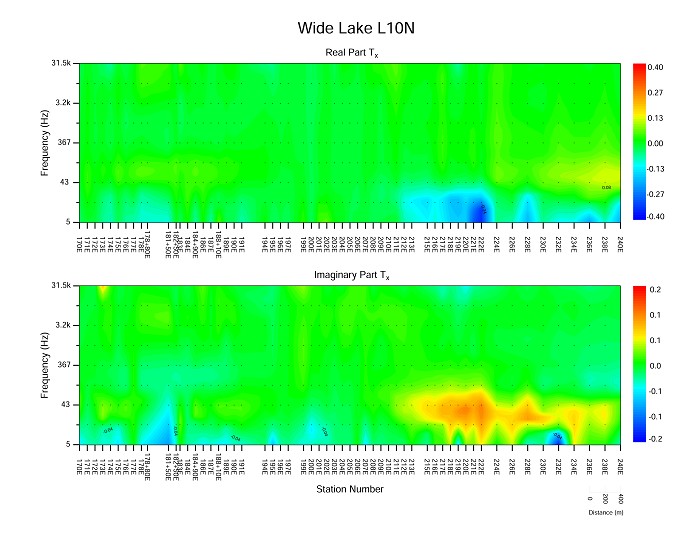
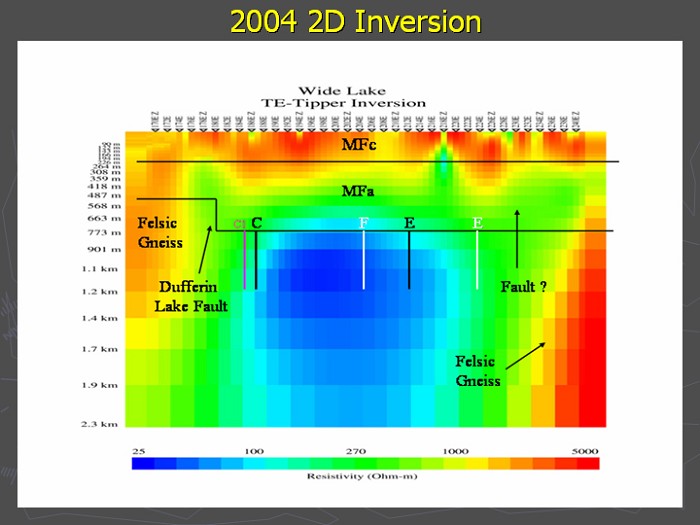
This geological situation was seen in the "real-world" at Wide Lake (northern Saskatchewan - Centennial deposit) where a transient AMT survey was conducted in 2004. As shown below, the tipper data is dominated by the channeling response of a 2000 m wide conductive block of basement meta-pelites, with no clear indications of the embedded graphitic conductors within, with the exception of an oblique to line and/or 3D response seen at the east end of line near 215E (see Tx plot).
More IFG data needs to be collected in different geological environments, but it appears that 3D forward modeling is requried for proper gradient estimation.
Interested parties are encouraged to contact EMpulse to test this very promising technology on their property(s).
